Platform Capabilities Solutions Industries Sustainability About intelliONE Book a Demo
Home / Capabilities

Powerful capabilities. One platform.

Everything below runs on the same platform, against the same devices, inside the same account structure.

Device management

Manage your connected estate from one place

Create, configure and monitor devices across sites and accounts — meters, sensors, trackers, switches, gateways and other connected equipment.
Central inventoryStatus & connectivityLatest readingsGroupingCloningDevice commandsHealth monitoring
Asset management

Manage more than devices

Associate connected devices with the real-world assets they represent, so several sensors group against the one thing your business actually manages.

VehiclesEquipmentInfrastructureSitesSubstationsLightingPeople
Asset — Delivery vehicle DBN-14
GPS tracker · location & movement
Fuel sensor · consumption
Temperature probe · cold-chain
Stop managing sensor IDs. Start managing the assets that matter.
Dashboards

Your operation at a glance

Dashboards focus on current state and immediate action, where analytics explain historical behaviour.
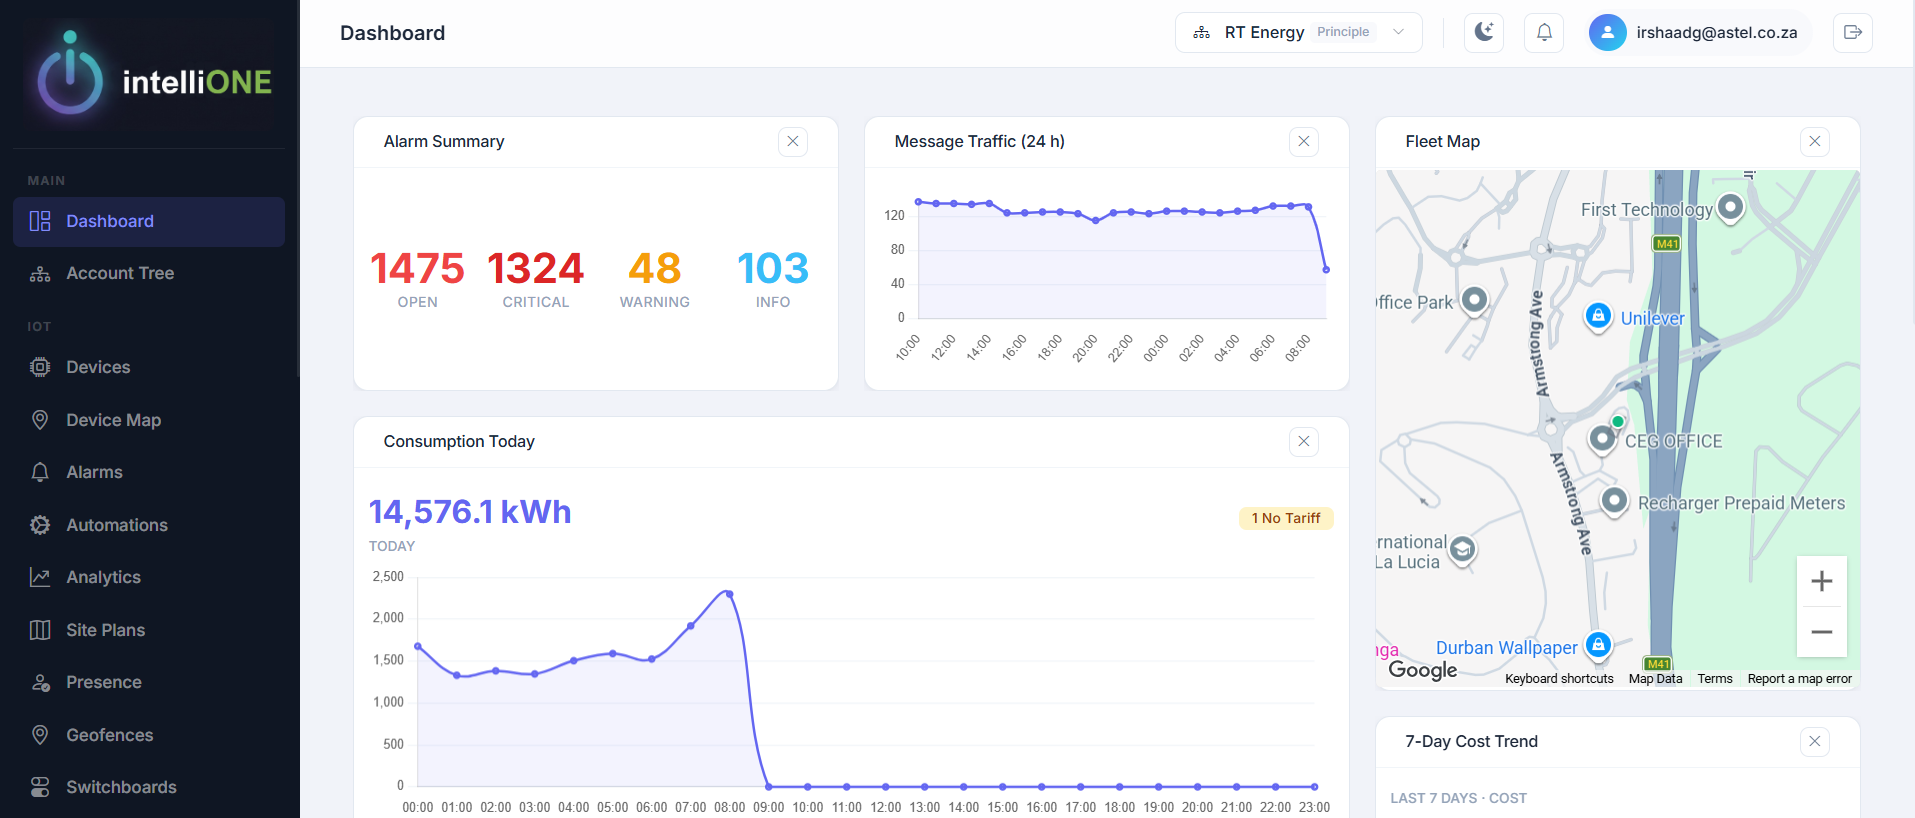
Device statusOperational KPIsConsumptionActive exceptionsConnectivityAsset locationCurrent alarms
Analytics & reporting

Turn operational data into insight

Analyse information across time instead of watching live values, with configurable and exportable reporting.
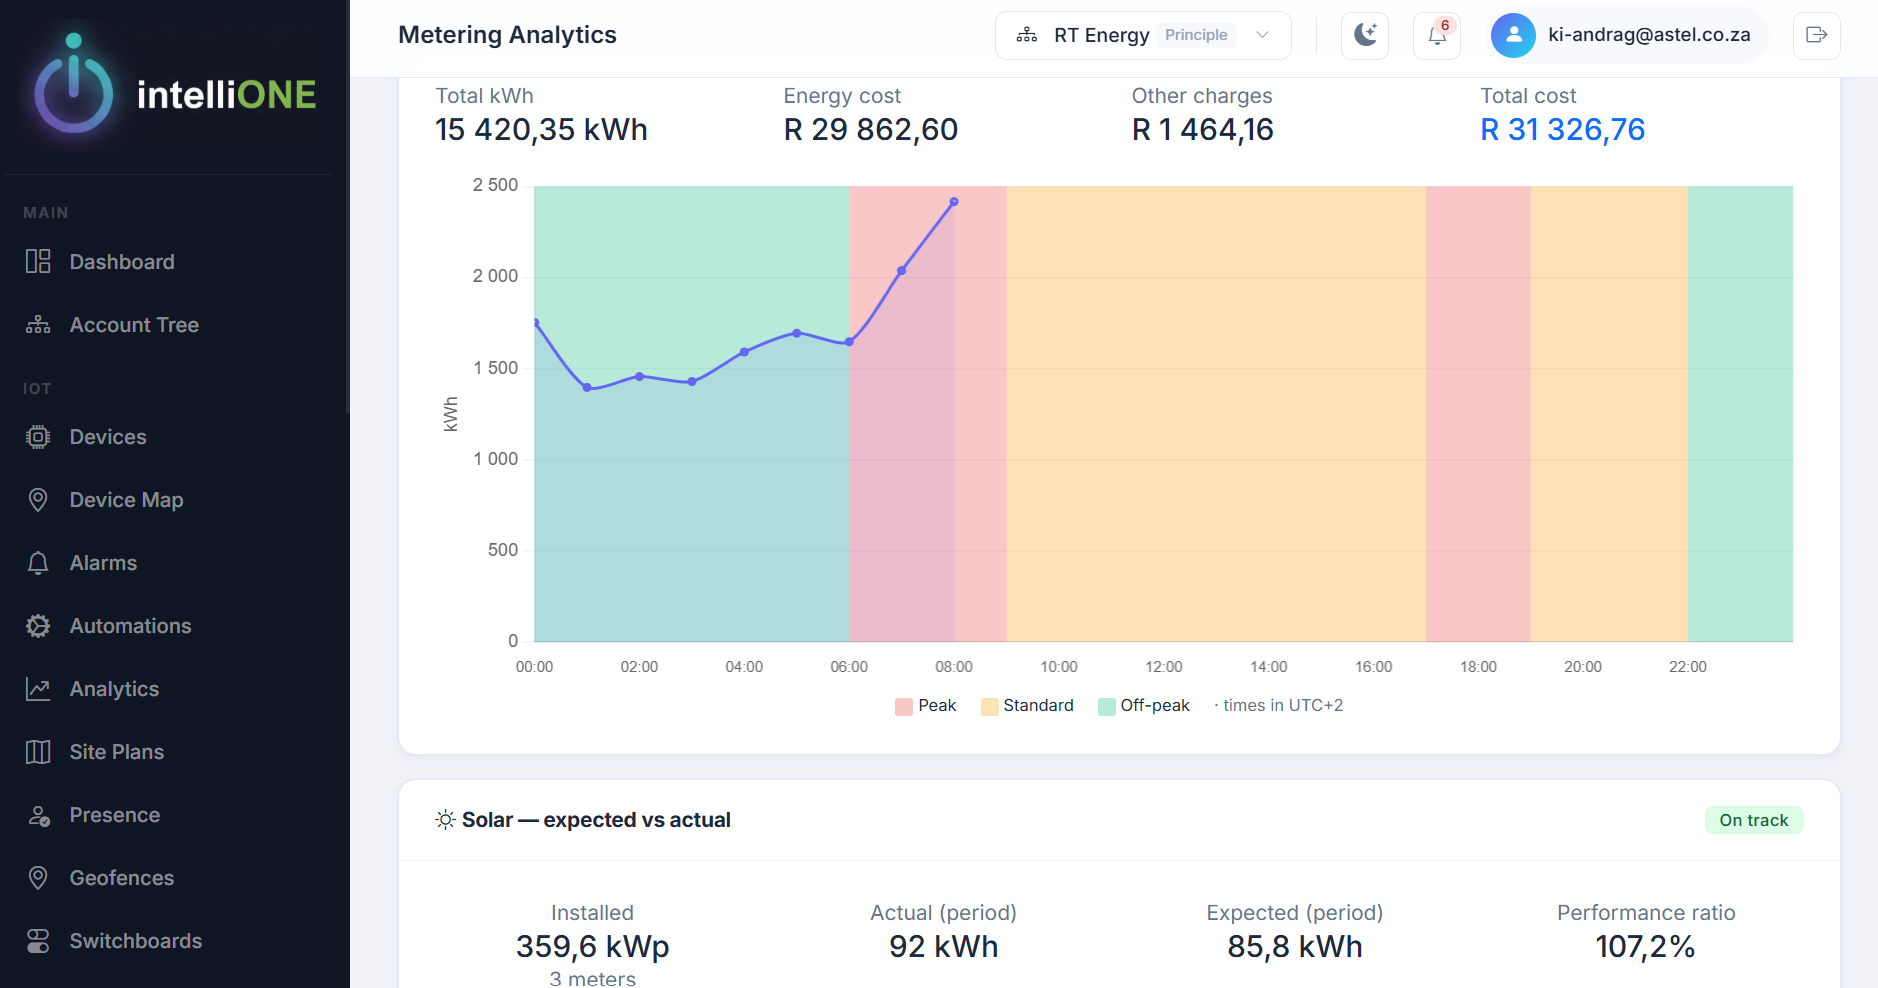
TrendsAbnormal behaviourCost driversSite comparisonsDevice performanceMovement patterns
Device map

See your connected estate geographically

Fixed devices map to their captured coordinates; tracking devices use their latest GPS position.
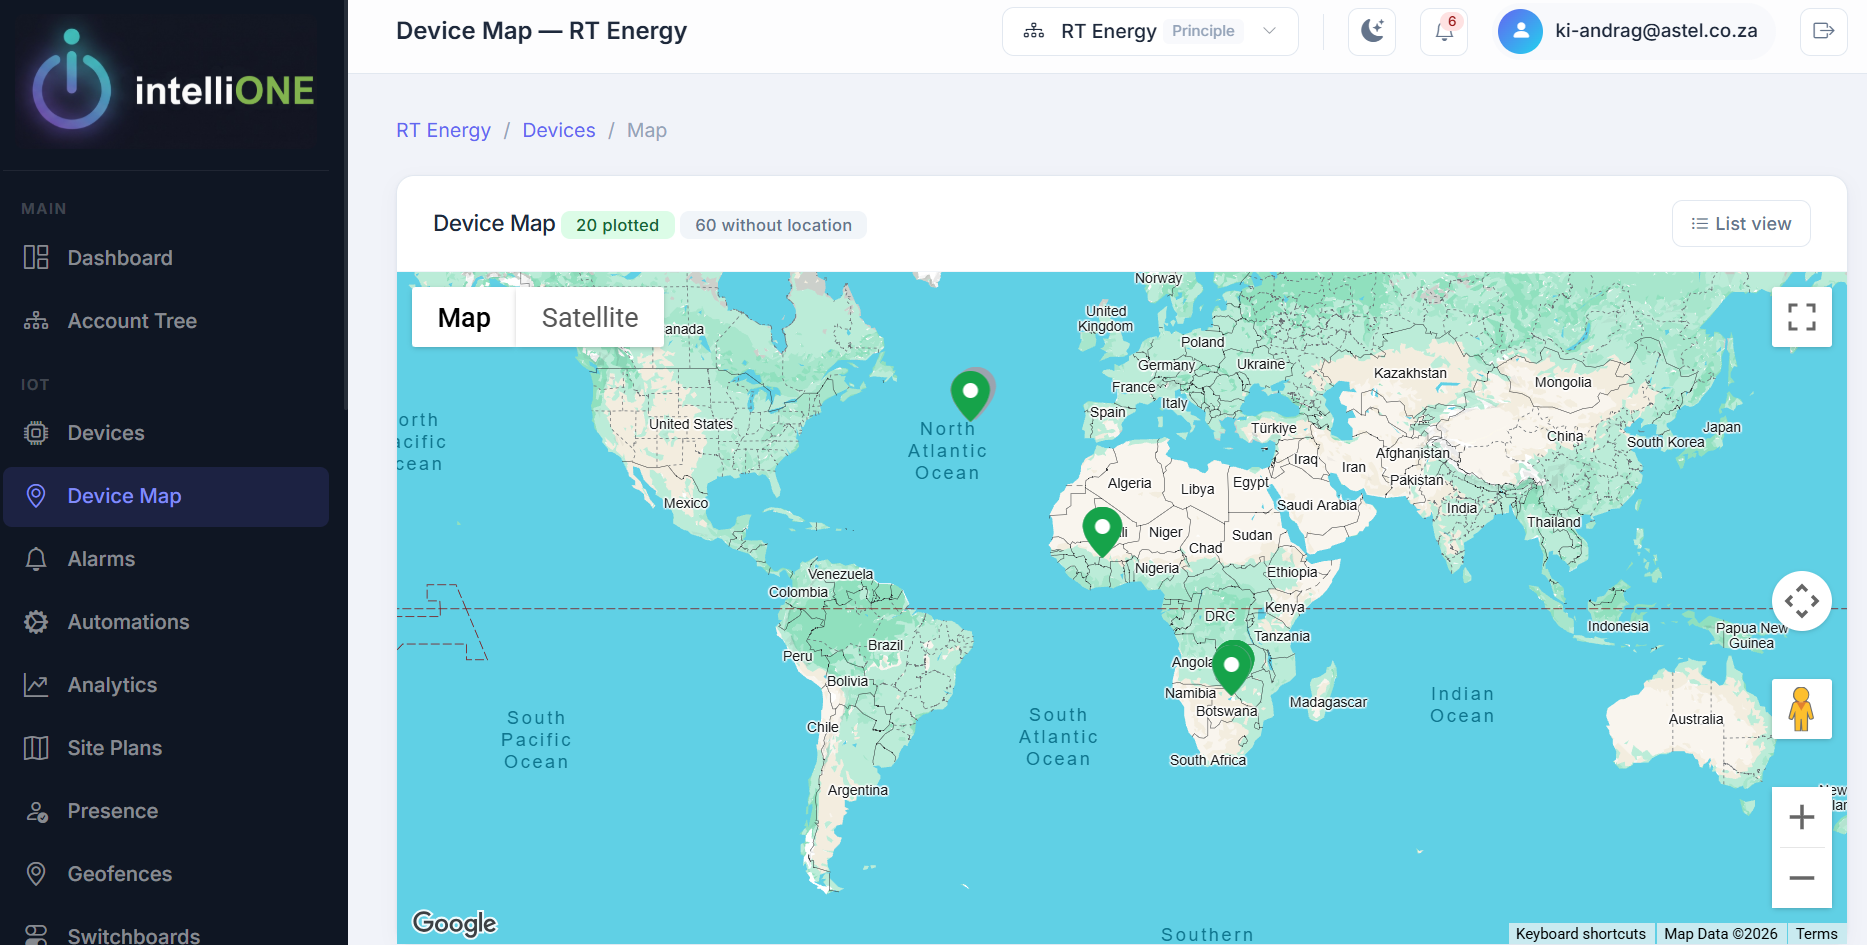
Device locationsMap & satelliteLatest GPS positionSite-level mapping
Geofencing

Turn locations into operational zones

Virtual boundaries around depots, warehouses, loading bays, farms, customer sites and restricted areas — monitored for what enters and leaves.

Custom zonesNested geofencesEntry & exit eventsCrossing historyActivity mapsZone alerts
Enters zoneVehicle arrives at the depot — arrival time recorded
DwellTime on site measured against the expected window
Exits zoneDeparture logged and the journey closed off
Fleet & asset tracking

Track movement. Understand utilisation.

Connect GPS-enabled assets and vehicles for visibility beyond dots on a map — depot activity, route events and the metrics attached to each journey.

Live positionLocation historyGeofence activityDepot activityMovement analysisJourney metrics
Worked example

A vehicle with GPS and fuel monitoring

When it left the depot, which location it visited, when it arrived and departed, whether the expected route occurred — and the fuel used getting there.

Alerts & automation

Know when something needs attention

Configure rules around the conditions that matter, with severity levels and notification controls. Then let automation respond on its own.

Out-of-range readingsDevice offlineLow batteryThreshold exceededDemand approaching limitZone entry/exit
If a condition occursCreate an alarm
If a threshold is exceededNotify the responsible team
On a scheduleSend a device command
Outside allowed hoursTrigger an action automatically
Remote control

Control equipment from anywhere

Custom switchboards represent real-world controls through a digital interface. Operators act manually; workflows act without them.
On/off switchingLighting controlHVAC controlOperational relaysScheduled control
ManualAn operator opens the switchboard and acts directly
ScheduledA defined schedule sends the command unattended
AutomatedA workflow reacts to a condition and commands the device
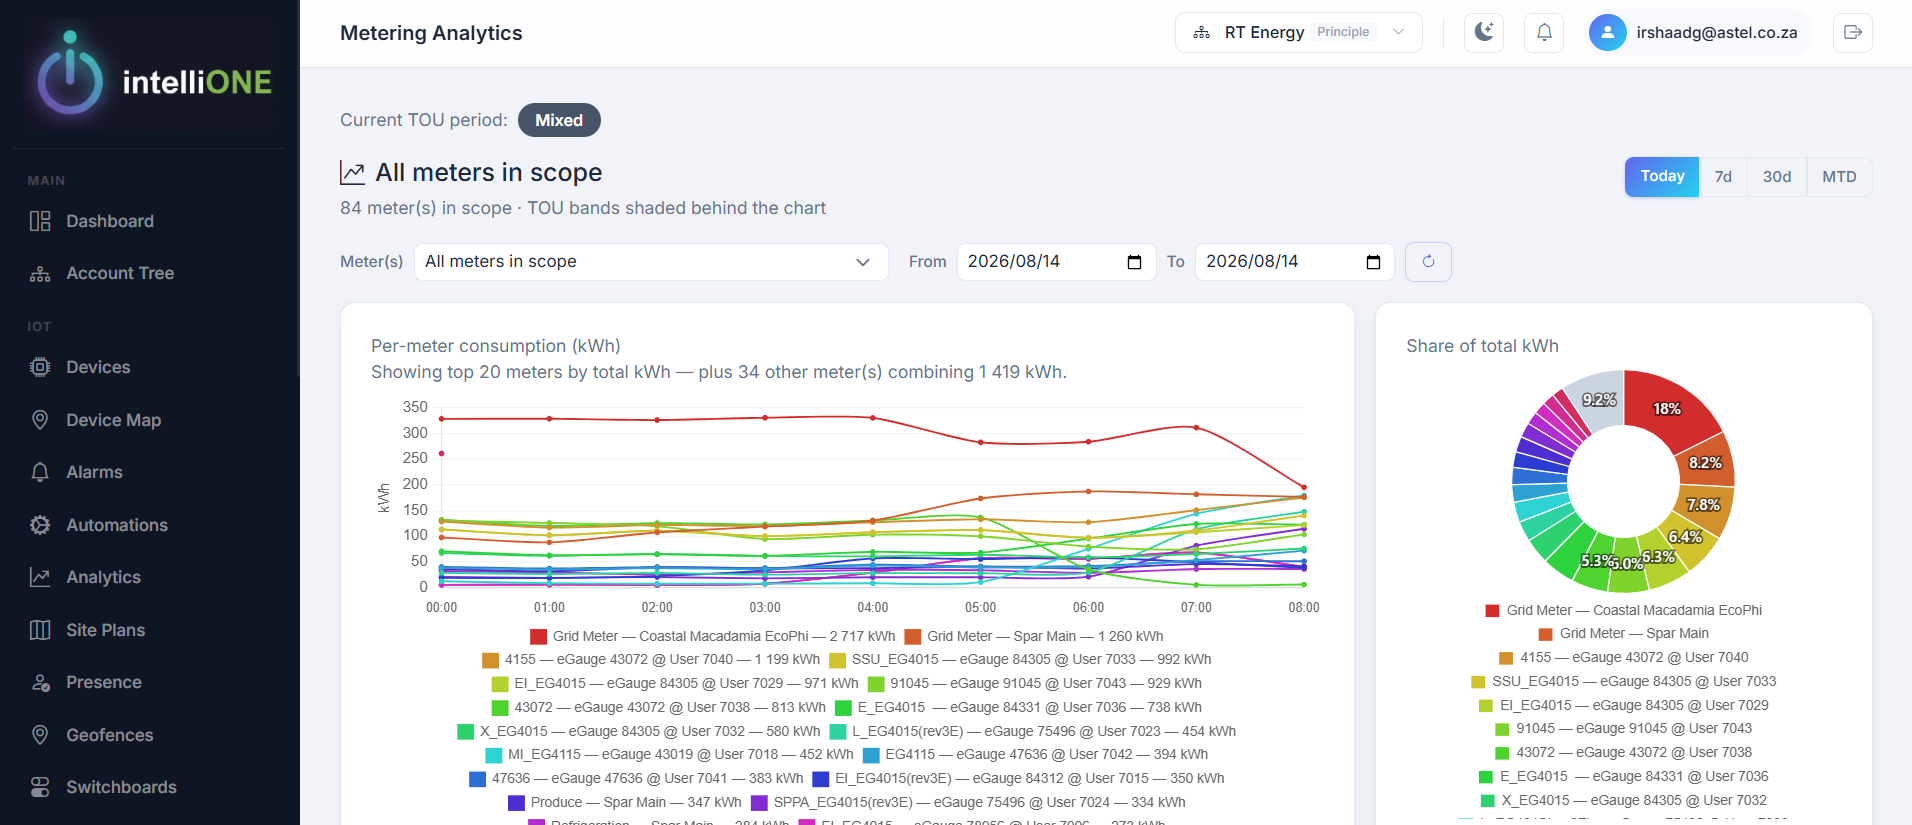
Energy & metering

Understand energy. Control cost.

A single physical device can support multiple metering points, so different areas or loads are measured without duplicating consumption.

Multi-meter devices

Main incomer, refrigeration, HVAC, production, tenant or department — measured separately from one device.

Tariffs & demand

Time-of-use, seasonal and fixed charges applied per metering point — with alerts before demand becomes a penalty.

Solar performance

Expected generation against actual production, with performance ratio and historical trend.

The point

The value is not knowing how much energy you used. It is knowing what you can change.

Sustainability & emissions

Measurable sustainability performance

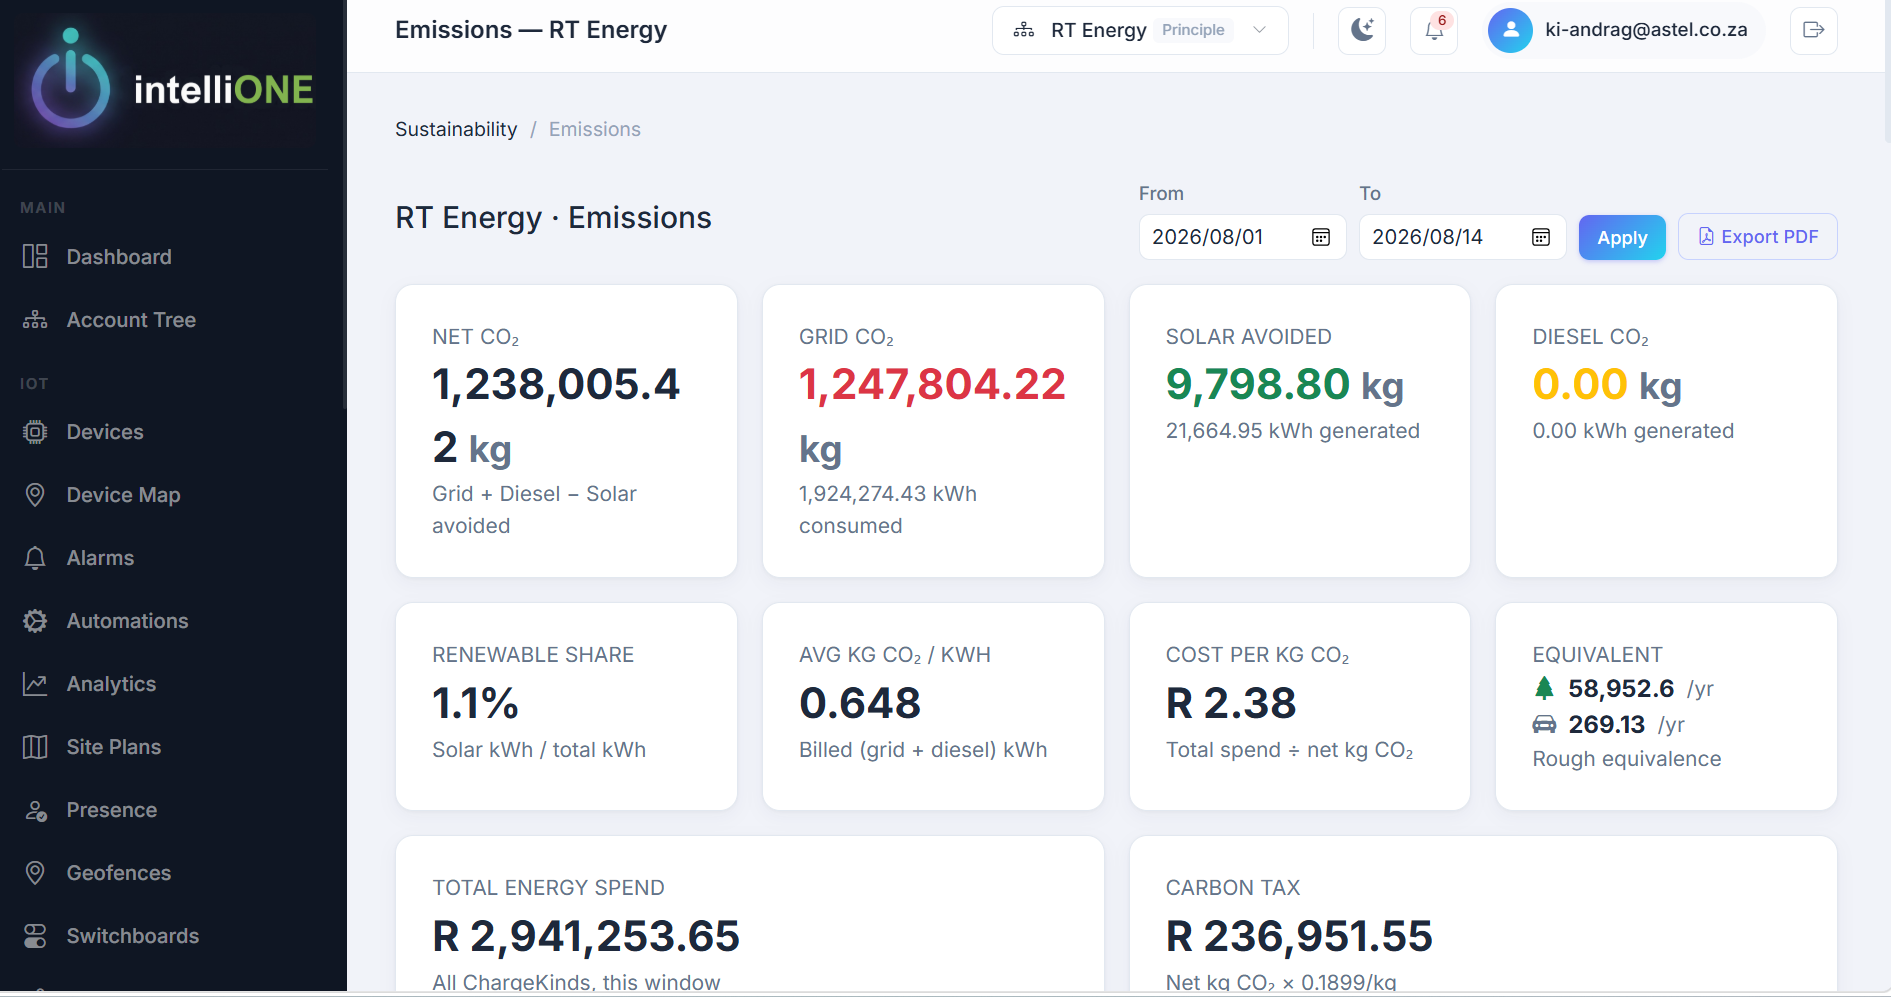
Carbon calculated from actual consumption rather than a broad annual estimate.

intelliONE · Emissions
intelliONE emissions dashboard showing net CO2, grid CO2, solar avoided and diesel CO2, plus renewable share, average CO2 per kWh, cost per kg CO2 and carbon tax
Grid CO₂Diesel CO₂Solar avoided Net CO₂Renewable shareCO₂ per kWhCarbon cost
Environmental monitoring

Monitor the conditions around your operation

The same device model supports temperature, humidity, air quality and equipment-state sensing — for cold chain, laboratories, warehouses, agriculture and equipment rooms.

TemperatureHumidityAir qualityWeatherEquipment state
Presence & site plans

People and places, in context

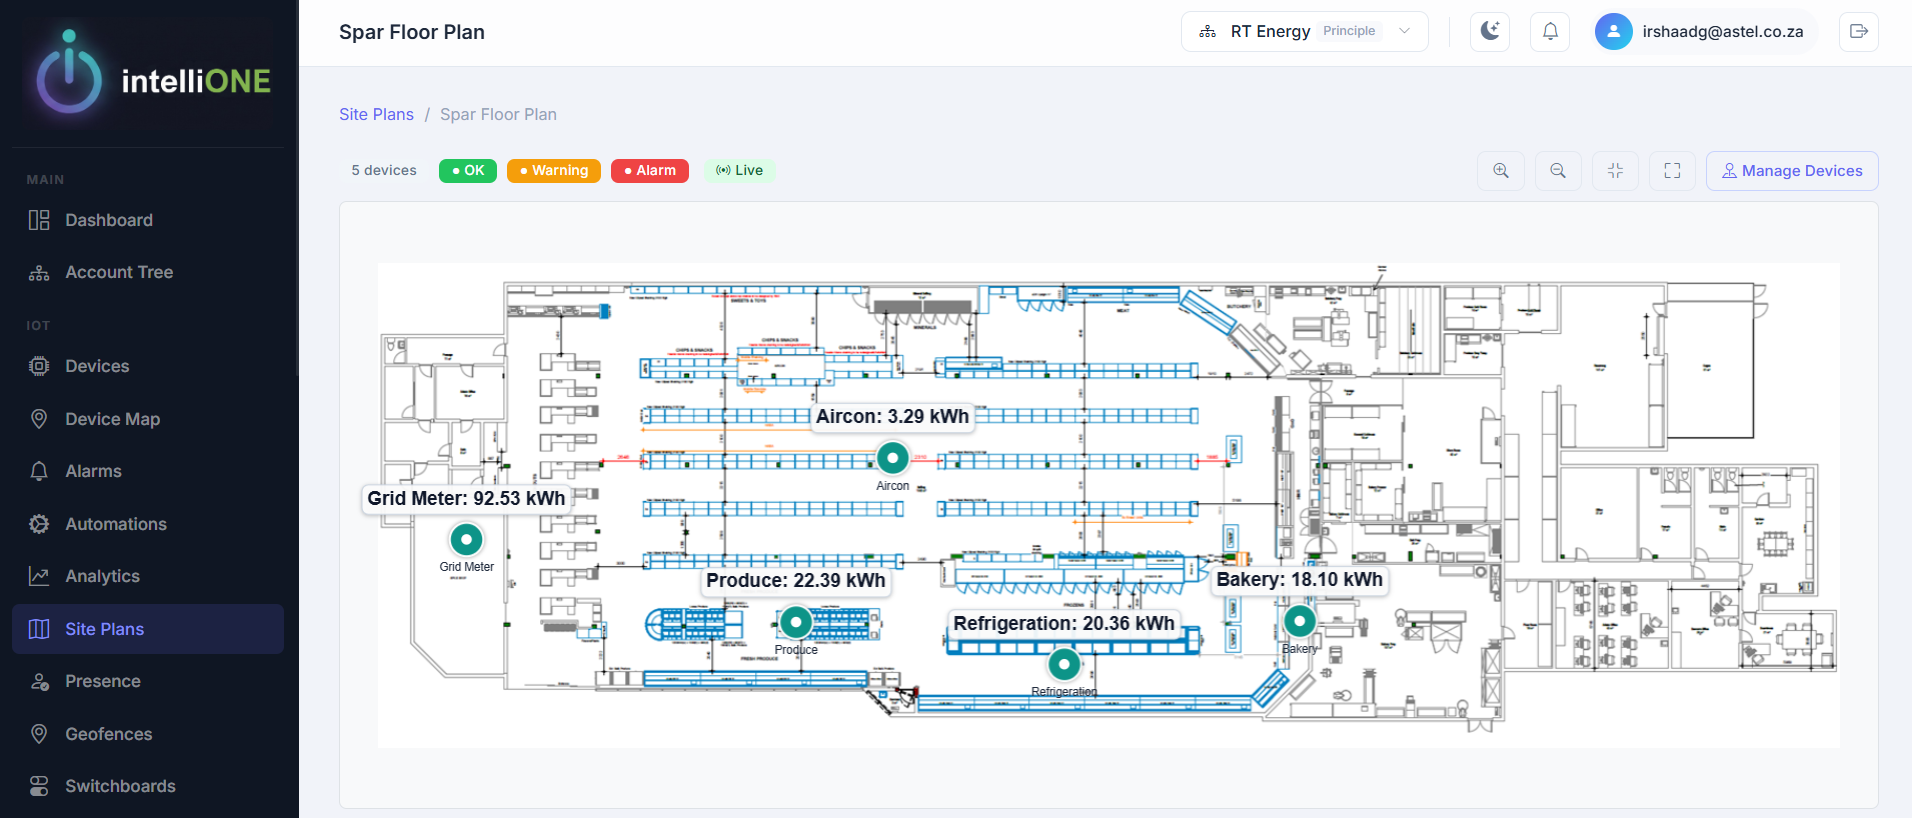
The asset model extends to people where the devices and privacy requirements allow. Interactive site plans place devices at their real physical location, so operators navigate a building visually.

Zone attendanceEntry & exitLocation historySite plans